Research with a sample of respondents. How to Conduct Effective Research
·26 min read

Conducting research is a fundamental strategy for collecting valuable data that can guide business, academic, and policy decisions. However, for research results to be valid and representative, it is essential to select an appropriate sample of respondents. In this article, we will explore the necessary steps to conduct effective research with samples of respondents, ensuring accurate and useful results.
See also: Unveiling the World of Market Research Panels: Connection with Respondent Panels
1. Define the Research Objective with a sample of respondents
Before starting any research, it is crucial to clearly define its objective. What do you hope to discover? What specific questions do you want to answer? Having a clear objective helps direct all aspects of the research, from questionnaire design to data analysis.
Defining the research objective is a crucial step that serves as the foundation for the entire investigation process. Without a clear objective, research can become disorganized, and the data collected may not provide the necessary information to make informed decisions. Let's explore how to effectively define your research objective with a sample of respondents.
1.1. Identify the Problem or Opportunity
The first step to defining the research objective is to clearly identify the problem or opportunity you are trying to address. Ask yourself: What is the central question that needs to be answered? For example, a company might want to understand why its sales are declining, or a non-profit organization might want to evaluate the impact of a new program.
1.2. Be Specific in Research with a sample of respondents
Vague objectives lead to vague results. Therefore, be specific about what you want to discover. Instead of a broad objective like “understand customer satisfaction,” a specific objective would be “measure customer satisfaction regarding customer service and identify areas for improvement.”
1.3. Establish Research Questions
Transform your general objective into specific research questions. These questions will guide the development of the questionnaire and the collection of data. For example, if the objective is to measure customer satisfaction, your research questions might include: “How do customers rate our service?”, “What aspects of our service do customers value most?” and “What are customers' main complaints?”.
1.4. Define the Scope of Research with a sample of respondents
Determine the scope of your research to keep the project manageable and focused. The scope includes the target population, the time period to be studied, and available resources. Defining the scope helps avoid collecting excessive data that does not directly contribute to answering your research questions.
1.5. Align with Organizational Objectives
Ensure that the research objective is aligned with the overall organizational goals. This ensures that the insights gained will be relevant and applicable. For example, if the company's goal is to improve customer retention, the research should focus on understanding the factors that influence customer loyalty.
1.6. Document the Objective
Document the research objective clearly and concisely. This documentation will serve as a reference for all subsequent stages of the research, ensuring that all team members are aligned and working towards the same goal.
1.7. Review and Adjust Research with a sample of respondents
Regularly review the research objective as the project progresses. Sometimes, new information or changes in context may require adjustments to the initial objective. Maintaining flexibility to adjust the objective as needed is crucial for research success.
Online respondent panel company. How does it work?
Practical ExampleImagine you work for a technology company that is about to launch a new mobile application. The research objective could be defined as follows: Research Objective: Evaluate the acceptance of the new mobile application among target users and identify the most and least valued functionalities. Research Questions:
Scope:
|
Online survey responses through an online respondent panel
2. Determine the Target Population in Research with a sample of respondents
The target population is the group of people about whom you want to obtain information. It can be a broad group, such as all consumers in a country, or more specific, such as women between 30 and 40 years old living in urban areas. Knowing your target population is essential to ensure that the selected sample is representative.
Determining the target population is an essential step to ensure that the collected data is relevant and representative of the group you wish to study. The target population is the specific group of individuals about whom you want to obtain information. A clear and precise definition of the target population helps direct data collection and obtain results that can be generalized to the group in question. Let's detail how to effectively determine the target population.
2.1. Understand the Purpose of the Research
The first step to determining the target population is to clearly understand the purpose of the research. Understanding what you intend to discover or solve with the research will guide the identification of the interest group. For example, if you want to measure customer satisfaction with a specific product, your target population will consist of users of that product.
2.2. Identify Relevant Characteristics
Define the characteristics that are relevant to your research. These characteristics may include demographic data (age, gender, income), geographical location, consumption behavior, among others. For example, a survey on online shopping habits may focus on individuals who make online purchases at least once a month.
2.3. Segment the Population of Research with a sample of respondents
Segment the target population into homogeneous subgroups (strata) that share common characteristics. This can be useful for comparing different segments within the population and obtaining more detailed insights. For example, in a media preference survey, you can segment the population by age group to analyze how media consumption varies between young and old.
2.4. Consider Accessibility
Evaluate the accessibility of the target population. Certain groups may be more difficult to reach due to factors such as location, contact availability, or willingness to participate in the research. It is important to consider these aspects when defining your target population to ensure that you can collect sufficient and representative data.
2.5. Define Inclusion and Exclusion Criteria
Establish clear inclusion and exclusion criteria for the target population. These criteria will help refine the interest group and avoid including individuals who are not relevant to the research objective. For example, if you are studying the effectiveness of a hypertension medication, you should only include patients diagnosed with hypertension and exclude those with medical conditions that could interfere with the results.
2.6. Use Reliable Data Sources
To define and identify your target population, use reliable and up-to-date data sources. Demographic data from censuses, customer records, market databases, and previous surveys can provide valuable information about the characteristics and size of the target population.
2.7. Review and Adjust Research with a sample of respondents
Regularly review the definition of the target population as you collect preliminary data. New information may reveal the need to adjust your definition to better meet the research objective. Flexibility is essential to respond to new insights and ensure research accuracy.
Practical ExampleImagine a healthy food company wants to launch a new line of organic products and wants to understand the preferences of its target market. The definition of the target population could be done as follows: Research Objective: Identify the preferences and consumption habits of organic foods among potential consumers. Relevant Characteristics:
Segmentation:
Inclusion Criteria:
Exclusion Criteria:
|
Market research with an online respondent panel
3. Choose the Type of Sample in Research with respondents
The choice of sample type is one of the most critical steps in conducting a survey, as it directly influences the representativeness and accuracy of the results. There are several sampling methods available, each with its advantages and disadvantages. The selection of the appropriate method depends on the research objective, the characteristics of the target population, and the available resources. Let's explore the main types of sampling and how to choose the most appropriate one for your research.
3.1. Simple Random Sampling |
Definition: Each member of the population has an equal chance of being selected.
Advantages:
- Provides an accurate representation of the population.
- Reduces the risk of selection bias.
Disadvantages:
- Can be difficult to implement in large populations.
- Requires a complete list of the population, which is not always available.
When to Use: Ideal for studies where a complete list of the population is available and a representative sample without specific biases is desired.
3.2. Stratified Sampling |
Definition: The population is divided into homogeneous subgroups (strata), and a random sample is drawn from each stratum.
Advantages:
- Ensures that all important subgroups are represented.
- Increases the precision of estimates by reducing variability within each stratum.
Disadvantages:
- Can be complex and time-consuming.
- Requires detailed prior knowledge about the population.
When to Use: Effective when the population has distinct subgroups and you want to ensure the representation of each of them, such as in market research with different customer segments.
3.3. Systematic Sampling |
Definition: Every n-th member of the population is selected after a random starting point.
Advantages:
- Simple and quick to implement.
- Suitable for large populations.
Disadvantages:
- Can introduce bias if there is a pattern in the population list.
- Less flexible compared to other random sampling methods.
When to Use: Useful when you have an ordered list of population members and want a simple selection method, such as in quality audits.
3.4. Convenience Sampling |
Definition: Individuals who are easy to access are selected.
Advantages:
- Quick and economical.
- Easy to implement.
Disadvantages:
- High probability of bias.
- Results are not generalizable to the entire population.
When to Use: Suitable for exploratory or pilot studies, where the objective is to gain initial insights quickly and at low cost.
3.5. Quota Sampling |
Definition: A sample that reflects certain characteristics of the population is selected, filling quotas for different subgroups.
Advantages:
- Ensures representation of key characteristics.
- More controlled than convenience sampling.
Disadvantages:
- Can introduce bias if quotas are not defined correctly.
- Less probabilistic than other methods.
When to Use: Useful in public opinion and market research where it is desired to reflect the demographic composition of the population.
3.6. Snowball Sampling |
Definition: The first respondents indicate new participants, forming a chain of samples.
Advantages:
- Useful for accessing hard-to-reach populations.
- Allows exploration of social or professional networks.
Disadvantages:
- Can introduce selection bias.
- Representativeness is limited to initial networks.
When to Use: Ideal for research on specific or hidden groups, such as studies on specific communities or marginalized populations.
Shopper Panel. What is it? Types of panels and advantages
How to Choose the Right Sample Type in Respondent Research
1. Consider the Research Objective:
- If you need generalizable results for the entire population, random methods (simple random or stratified sampling) are preferable.
- For exploratory or feasibility studies, convenience or snowball sampling may suffice.
2. Evaluate Available Resources:
- More rigorous samples, such as simple random, may require more time and resources.
- Methods like convenience sampling are more economical and faster, but sacrifice precision.
3. Analyze the Target Population:
- If the population is homogeneous, simple random sampling may be sufficient.
- For heterogeneous populations with distinct subgroups, stratified sampling is more appropriate.
4. Plan the Implementation:
- Determine if you have access to a complete list of the population for random methods.
- Consider the logistics of contacting respondents and data collection.
Choosing the correct sample type is fundamental for the validity and reliability of research results. Each method has its particularities, and it is important to consider the research objectives, available resources, and characteristics of the target population when making this choice. By selecting the most appropriate sampling method, you can ensure that your research is representative and provides valuable and accurate insights.
Online consumer panel. Insights for your projects

4. Determine the Sample Size in Respondent Research
Determining the sample size is a crucial step in research planning, as it directly impacts the precision and representativeness of the results. An adequate sample size ensures that the collected data is sufficient to make inferences about the target population, minimizing sampling errors and biases. Let's explore how to effectively determine the sample size.
4.1. Understand the Basic Concepts
Before determining the sample size, it is important to understand some basic statistical concepts:
- Margin of Error (Sampling Error): The margin of error indicates the amount of error you can tolerate in the survey results. It is expressed as a percentage and represents the interval within which the sample results approximate the true population values.
- Confidence Level: The confidence level indicates the probability that the survey results are within the specified margin of error. It is usually expressed as a percentage (e.g., 95% or 99%).
- Variability: Refers to the distribution of responses in the population. The greater the variability, the larger the sample size should be to obtain accurate results.
4.2. Use Statistical Formulas
The basic formula for calculating sample size is:
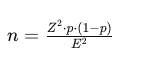
Where:
- n = sample size
- Z = z-value corresponding to the desired confidence level (e.g., 1.96 for 95%)
- p = estimated population proportion (if unknown, use 0.5 for maximum variability)
- E = margin of error
For finite populations, the adjusted formula is:
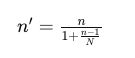
Where:
- ′n′ = sample size adjusted for the finite population
- N = total population size
4.3. Consider the Total Population in Research with respondent samples
If the total population (N) is small, it is possible to adjust the sample size to reflect this. In general, the smaller the population, the smaller the sample needed to achieve the same level of precision.
4.4. Use Sample Size Calculators
There are several online calculators that can help determine the sample size based on the specific parameters of your research. These tools are useful for simplifying calculations and ensuring accuracy.
4.5. Evaluate Data Variability
If you have historical data or previous research on the target population, use this information to estimate variability (p). The more accurate the variability estimate, the more accurate the sample size calculation will be.
4.6. Balance Resources and Precision in Research with Respondent Samples
Although a larger sample size increases the precision of the results, it also implies higher costs and time. It is essential to balance the need for precision with available resources. In many cases, a slightly smaller sample may be adequate if resources are limited.
4.7. Consider the Response Rate
The expected response rate should be considered when determining the sample size. If the predicted response rate is low, you may need to increase the initial sample size to ensure that the final number of respondents is sufficient.
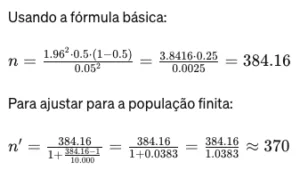
Practical ExampleImagine you are conducting a survey to measure customer satisfaction for a retail store. You have defined the following:
Therefore, you would need a sample of approximately 370 customers to obtain accurate results within a 5% margin of error with a 95% confidence level. |
Determining the sample size is a fundamental step to ensure the validity and accuracy of research results. Understanding the basic concepts of margin of error, confidence level, and variability, in addition to using appropriate statistical tools, allows for calculating a sample size that balances precision and available resources. Remember to adjust for the total population and consider the expected response rate to ensure that the results are representative and actionable.
How to set up an efficient survey on online panels
5. Data Collection in Research with Respondent Samples
Data collection is a crucial step in conducting research, as it is when the necessary information is obtained to analyze and answer research questions. The accuracy and relevance of the collected data are fundamental to ensure that the results are valid and useful. Below, we will detail how to effectively collect data in research with a respondent sample.
5.1. Choosing the Data Collection Method
The first step is to choose the most appropriate data collection method for your research. Each method has its advantages and disadvantages, and the choice depends on the research objective, the type of data you need to collect, and the available resources. Here are some common methods:
- Online Questionnaires: Fast and economical, they allow reaching a large number of respondents. However, they depend on internet access and may have variable response rates.
- Telephone Interviews: Allow for detailed and immediate data collection. However, they can be expensive and time-consuming to cover a large sample.
- Face-to-Face Interviews: Offer rich and detailed data, but are expensive and time-consuming.
- Mail Surveys: Useful for reaching populations without internet access, but tend to have low response rates and are slow.
- Focus Groups: Allow detailed discussions on specific topics, but have limited reach and can introduce group bias.
5.2. Developing the Collection Instrument
The data collection instrument (questionnaire, interview script, etc.) must be carefully designed to ensure that the collected information is valid and reliable. Consider the following aspects:
- Clarity of Questions: Use simple and direct language. Avoid technical terms or jargon that may confuse respondents.
- Type of Questions: Include a combination of closed-ended questions (for objective answers) and open-ended questions (for detailed answers). Closed-ended questions are easier to analyze, while open-ended questions provide qualitative insights.
- Order of Questions: Structure the questionnaire logically, starting with more general questions and progressively moving to more specific issues.
- Pilot Test: Conduct a pilot test with a small part of the sample to identify and correct problems in the questionnaire before large-scale collection.
5.3. Ensuring Confidentiality and Ethics
The confidentiality of respondents must be guaranteed to obtain honest answers and protect participants' privacy. Clearly inform respondents about the purpose of the research, how their data will be used, and ensure that their responses will be confidential.
- Informed Consent: Obtain informed consent from all participants, explaining the research objective, data usage, and ensuring confidentiality.
- Anonymity: Whenever possible, maintain the anonymity of respondents to increase the honesty of responses.
5.4. Data Collection Team Training
If data collection is carried out by a team, it is essential that all members are well-trained. This ensures consistency in the application of the collection instrument and the quality of the data collected.
- Clear Instructions: Provide clear instructions on how to administer the questionnaire or conduct interviews.
- Simulations: Conduct data collection simulations to practice and resolve doubts.
5.5. Data Collection Monitoring
During the collection process, regularly monitor progress to ensure it is in line with the plan. Check the quality of the collected data and make adjustments if necessary.
- Data Verification: Periodically review collected data to identify and correct inconsistencies or errors.
- Continuous Feedback: Maintain continuous communication with the collection team to resolve problems in real time.
5.6. Maximizing Response Rate
To obtain a representative sample, it is important to maximize the response rate. Some strategies include:
- Incentives: Offer incentives, such as prizes or rewards, to motivate participation.
- Reminders: Send friendly reminders to respondents who have not yet completed the survey.
- Flexibility: Offer different response options (online, by phone, in person) to increase participant convenience.
Practical ExampleImagine you are conducting a survey to assess customer satisfaction with a streaming service. Here's how you can apply the steps mentioned: Collection Method: Online questionnaires sent by email to subscribers. Questionnaire Development:
Confidentiality and Ethics: Clear explanation at the beginning of the questionnaire about data usage and guarantee of anonymity. Team Training: Team trained to handle technical questions and ensure consistency in data collection. Monitoring: Weekly review of responses to ensure quality and resolve issues. Maximizing Response Rate: Sending weekly reminders and offering a free month of subscription as an incentive. |
Data collection is a vital step in any research with respondent samples. Choosing the appropriate method, developing an effective collection instrument, ensuring confidentiality and ethics, training the collection team, monitoring the process, and maximizing the response rate are fundamental steps to ensure the quality and representativeness of the collected data. By following these practices, you can obtain valuable and accurate information to answer research questions and make informed decisions.
6. Data Analysis in Research with a Respondent Sample
Data analysis is a crucial step that transforms collected information into meaningful insights. A well-executed analysis can reveal important patterns, trends, and relationships, helping to answer research questions and make informed decisions. Here is a detailed guide on how to conduct data analysis in a survey with a sample of respondents.
6.1. Data Preparation for Research with a Respondent Sample
Before starting the analysis, it is necessary to prepare the data to ensure it is accurate and consistent.
1. Data Cleaning:
- Duplicate Removal: Check for and remove duplicate responses.
- Handling Missing Data: Decide how to deal with missing data. Options include excluding incomplete responses or imputing substitute values.
- Error Correction: Identify and correct typos or inconsistencies in the data.
2. Data Coding:
- Qualitative Data Transformation: Convert open-ended responses into codable categories to facilitate quantitative analysis.
- Numeric Code Assignment: Assign numeric codes to categorical responses (e.g., 1 for “Yes”, 2 for “No”) to simplify analysis.
6.2. Choosing Analysis Techniques
The choice of analysis techniques depends on the types of data collected and the research questions. Key techniques include:
1. Descriptive Analysis:
- Means and Medians: Calculate measures of central tendency to summarize numerical data.
- Standard Deviations and Ranges: Measure the dispersion of data.
- Frequency Distributions: Show the frequency of each response in categorical data.
2. Inferential Analysis:
- Hypothesis Testing: Test hypotheses about the population based on the sample (e.g., t-tests, ANOVA).
- Confidence Intervals: Estimate the interval within which a population parameter should fall.
- Regression and Correlation: Analyze the relationship between variables (e.g., linear regression, Pearson correlation).
3. Qualitative Analysis:
- Thematic Coding: Identify themes or patterns in qualitative data.
- Content Analysis: Quantify the presence of certain words, themes, or concepts.
6.3. Use of Analysis Software in Research with a Respondent Sample
The use of specialized software can facilitate and speed up data analysis. Some of the most common software include:
- SPSS: Widely used for complex statistical analyses.
- R and Python: Powerful open-source tools for statistical and graphical analyses.
- Excel: Useful for descriptive analyses and basic charts.
- NVivo: Ideal for qualitative data analysis.
6.4. Interpretation of Results
Interpreting results is where you transform numbers and statistics into actionable insights.
1. Comparison with Hypotheses:
- Compare the obtained results with the hypotheses established at the beginning of the research.
- Determine whether the results support or refute the hypotheses.
2. Pattern Identification:
- Look for patterns and trends that can provide insights into respondents' behavior or opinions.
- Use graphs and tables to visualize data and facilitate pattern identification.
3. Context Consideration:
- Interpret the results within the context of the research and the characteristics of the target population.
- Consider external factors that may have influenced the results.
6.5. Reporting Research Results with a Respondent Sample
Clear communication of results is essential to ensure that insights are understood and utilized.
1. Written Reports:
- Prepare a detailed report that includes the methodology, results, and interpretation of the data.
- Use tables, graphs, and figures to illustrate key findings.
2. Presentations:
- Develop visual presentations to communicate results to stakeholders.
- Highlight key insights and recommendations concisely and visually appealingly.
3. Publications:
- If the results are relevant to a broader audience, consider publishing them in academic journals or market reports.
Practical ExampleImagine you conducted a survey on customer satisfaction with a streaming service. Here's how you could apply the data analysis steps: Data Preparation:
Descriptive Analysis:
Inferential Analysis:
Interpretation:
Reporting:
|
Data analysis is an essential step to transform raw data into valuable insights. By following the steps of preparation, choosing analysis techniques, using appropriate software, careful interpretation of results, and clear communication, you can ensure that your research provides accurate and actionable information. Well-executed analysis not only answers research questions but also guides strategic decisions and future improvements.
7. Report Research Results with a Respondent Sample
Reporting research results is the final, but crucial, step of any study. It is at this point that collected and analyzed data are transformed into actionable information and communicated to stakeholders. A well-structured report helps ensure that results are understood and used effectively. Below, we detail how to prepare a comprehensive and impactful research report.
7.1. Structure of the Survey Report with Respondent Sample
The structure of a research report should be clear and logical, facilitating the understanding of results and conclusions. A typical structure includes:
1. Introduction:
- Research Context: Explain the reason and importance of the study.
- Objectives: Define the specific objectives of the research.
- Research Questions: List the main questions or hypotheses investigated.
2. Methodology:
- Target Population: Describe the target population and how it was selected.
- Sampling: Detail the sampling method and sample size.
- Data Collection: Explain the methods used to collect data.
- Research Instrument: Include a description of the questionnaire or tools used.
3. Results:
- Descriptive Analysis: Present descriptive data, such as means, medians, and frequency distributions.
- Inferential Analysis: Describe the results of statistical tests, such as t-tests, ANOVA, correlations, or regressions.
- Key Findings: Highlight the main findings and patterns identified.
4. Discussion:
- Interpretation of Results: Explain what the results mean in relation to the research questions and objectives.
- Comparison with Previous Studies: Compare your results with those of previous research, if applicable.
- Practical Implications: Discuss the practical implications of the results for the study area or organization.
5. Conclusion:
- Summary of Findings: Provide a concise summary of the most important findings.
- Recommendations: Offer recommendations based on the research results.
- Limitations: Acknowledge the study's limitations and suggest areas for future research.
6. Appendices:
- Research Instrument: Include the questionnaire or interview script.
- Raw Data: If relevant, include raw data tables.
- References: List all sources cited in the report.
7.2. Presentation of Survey Results with Respondent Sample
How results are presented can significantly influence their understanding and impact. Use a combination of text, tables, and graphs to make the results clear and visually appealing.
1. Tables:
- Use tables to present detailed data, such as responses to closed-ended questions.
- Ensure tables are clearly labeled and include all necessary information to be understood independently.
2. Graphs:
- Use graphs (bar, pie, line) to visualize data intuitively.
- Choose the appropriate graph type for the data type (e.g., bar chart for comparisons, pie chart for percentage distributions).
3. Text:
- Describe the main results in text, highlighting the most relevant findings.
- Use bullet points to summarize key points and facilitate readability.
7.3. Communication of Survey Results with Respondent Sample
In addition to the written report, it is important to communicate the results effectively to all stakeholders. Consider the following strategies:
1. Presentations:
- Prepare visual presentations using tools like PowerPoint or Keynote.
- Highlight key findings, graphs, and tables.
- Practice the presentation to ensure clarity and confidence in delivery.
2. Executive Summary:
- Create an executive summary, especially for stakeholders who need a quick overview.
- Include key findings, conclusions, and recommendations concisely.
3. Workshops and Meetings:
- Organize workshops or meetings to discuss the results and their implications with the team or clients.
- Use these moments to answer questions and receive feedback.
Practical ExampleImagine you conducted a survey to assess customer satisfaction with a music streaming service. Here's how to report the results: Introduction:
Methodology:
Results:
Discussion:
Conclusion:
Presentation and Communication:
|
Reporting research results is a vital step to ensure that collected and analyzed data are used effectively. A clear structure, a visually appealing presentation, and effective communication are essential to convey insights in a way that can be understood and acted upon by all stakeholders. By following these guidelines, you can ensure your research has a significant and informative impact.
See: 5 important factors when hiring market research
Conducting a survey with respondent samples is a complex task that requires careful planning and attention to detail. By following the steps described above, you can significantly increase the likelihood of obtaining accurate and useful results. Always remember to clearly define your objective, know your target population, choose the appropriate sampling method, and rigorously analyze the data. Thus, your research will have a significant impact, providing valuable insights for informed decision-making.
Need a survey with a sample from an online panel? Count on Painel TAP.
Behind Painel TAP is a team passionate about data and insight generation, who finds in each project a challenge to seek the best and fastest solution for the most diverse types of needs and demands in online research and market investigation.